The Data Dilemma: How to Turn Metrics to Meaning
Picture this: your business is a whirlwind of activity – campaigns, customer interactions, sales, oh my! Amidst this hustle, how do you keep tabs on what's truly working? That's where data visualization swoops in to save the day. It's like having a pulse on your business's heartbeat.
With the right visual tools, you can easily understand and analyze your success metrics and KPIs using powerful visual analytics.
Connecting the Data Dots
The way in which data is connected holds true power. From development backgrounds, our Analytics team makes integrating disparate data sources into Power BI, Tableau, and Looker Studio simple.
While people sometimes overlook it, data integration plays a pivotal role in ensuring that comprehensive, centralized data fuels your dashboards. This integration simplifies your data visualization journey, enabling you to focus on insights, not logistics.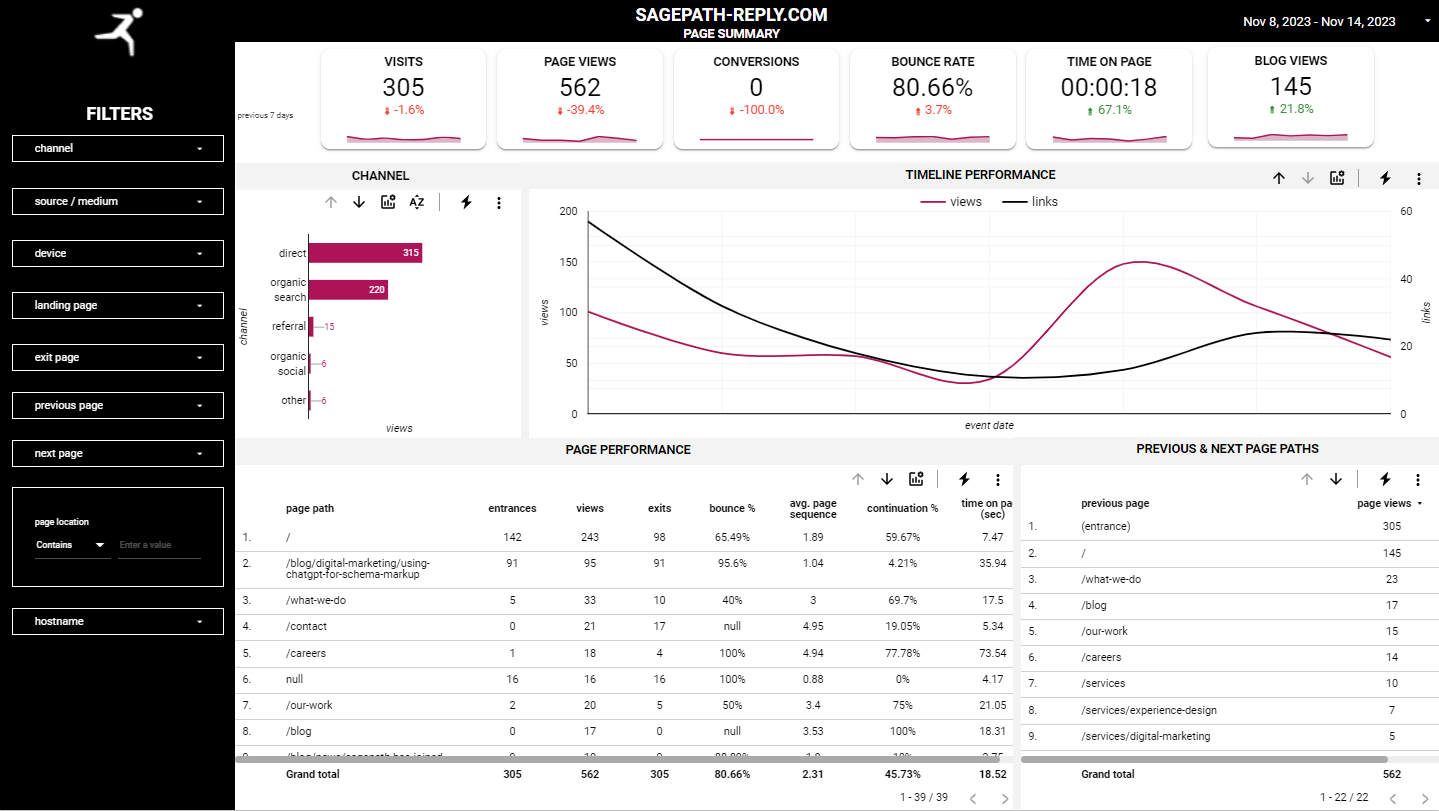
Templated Dashboards to Solve Your Businesses Needs
In the world of data-driven decisions, the art of data visualization reigns supreme. Our Analytics team has spent 15 years perfecting their skills in understanding clients' data visualization needs and identifying important business trends.
We have created a set of ready-made solutions that meet your needs and improve efficiency and value. Knowing what works best for businesses like yours gives birth to these solutions.
We can build a variety of dashboards, including:
- Search Engine Optimization Dashboards
- Website Performance Dashboards
- Email Marketing Dashboards
- Analytical Dashboards

Your Vision, Your Custom Dashboard
Looking for something more than our templated dashboard offerings? No matter how complex your requirements are, our expert team translates your vision into reality.
Our custom dashboards are a canvas where your data tells a story and answers business questions that are uniquely yours. From granular metrics to holistic overviews, we design and implement dashboards that empower you to explore, analyze, and act with clarity.
Need Other Visualization Solutions?
Do you need more than Power BI, Tableau, and Looker Studio visualization solutions? Our team also delivers great experience and visuals in other visualization platforms like Domo and Datorama.
Let's Revolutionize Your Data Strategy Together
Sagepath Reply's Analytics Team elevates your decision-making. We dive deep into your data and unearth patterns, trends, and actionable insights. Our commitment is to empower you to make data-driven and strategic decisions.
So, ready to revolutionize your data visualization strategy? We are your ally by tailoring our Power BI, Tableau, and Looker Studio dashboard solutions to your unique requirements. Unleash the potential of your data – reach out today to embark on a journey towards enriched insights and elevated outcomes.


Let’s Start a Conversation
Reach out to discuss your digital transformation needs and see how we can help. We would love to start a long-term partnership with your company.
Get in Touch